Is the website down?
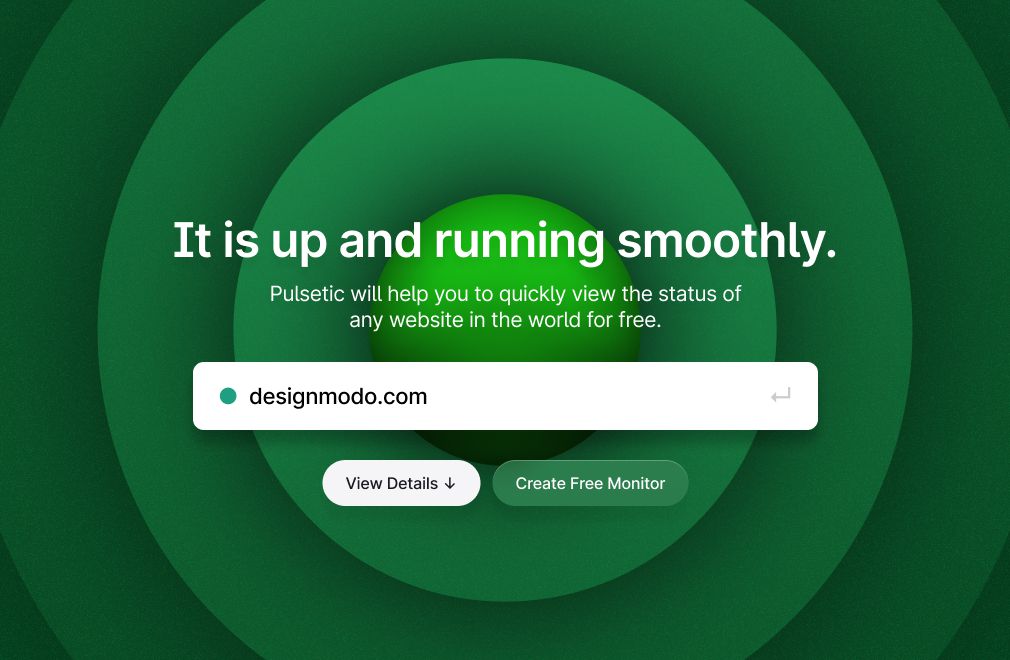
Check your website from 15 global locations and find out if it's down now. Take all the guesswork out of knowing if your website is down.

Monitor from around the world
Pulsetic checks your website around the clock from up to 15 locations across 5 continents. Results broken down by region show exact response times and availability, so you know whether your website is down globally or only in specific areas.

Get alerts the way you prefer
Get downtime alerts by email or webhook on every plan, and by SMS, WhatsApp, phone call, Slack, Microsoft Teams or Telegram from the Solo plan. Hear about it as soon as a second location confirms the failure, and recover faster with multi-channel notifications that reach you wherever you are.
Make personalized Status Pages
Create a public status page on your own domain to keep users informed during downtime. From the Solo plan, add your colors and logo and share live incident updates with email subscribers, to reduce support load and keep customer trust when your website goes down.
Website uptime is one piece of the picture. Pulsetic also monitors the services your website depends on.
Ping Monitoring
Check server and device availability by ICMP ping from multiple locations.
Port Monitoring
Monitor open TCP ports and get alerted if a service stops responding.
Domain Monitoring
Track domain expiry from the registry record, with reminders before a renewal lapses.
API Monitoring
Validate API endpoints and response payloads on a schedule you define.
Cron Job Monitoring
Get notified if a scheduled job runs late, fails, or stops running entirely.
Status Pages
Build a public status page on your own domain and keep users informed during incidents.
Paste the URL into the checker above. Pulsetic runs a live test from 15 locations across 5 continents and reports the response time and HTTP status code each one got back, so a regional failure is easy to tell apart from a total outage. Testing from outside your own network matters too. If the site loads for everyone but you, the cause is usually a stale DNS entry or something cached in your browser rather than the server.
Hosting and server failures are the most common, followed by expired domains and SSL certificates, DNS misconfiguration, traffic spikes that exhaust resources, botched deployments, and DDoS attacks. The status code narrows it down fast. A 500 means the application itself threw an error, a 502 or 504 means something upstream stopped answering, and a 503 usually means the server is overloaded or in maintenance mode. Whatever the code says, work out when it started. A deploy, a certificate renewal, or a config change at the same timestamp is usually your answer.
Checking by hand almost never catches anything. Outages are short and they do not wait for you to look, which is why monitoring has to run continuously. Pulsetic checks from every location you enable, every 5 minutes on the free plan and as often as every 30 seconds from the Team plan. The interval is not a detail either. Even 99.9 percent uptime leaves almost 9 hours of downtime in a year, and however long your interval is, that is roughly how long an outage can run before anyone hears about it.
Yes, and most visitors never notice. Deployments, server restarts, DNS changes still propagating, and planned maintenance all produce short gaps. What matters is separating those from the real thing. One failed check that passes on the next run is noise. Failures repeating across several regions are not. If you are taking the site down on purpose, return a 503 with a Retry-After header so search engines treat it as temporary.
Most of it is unglamorous. Pick hosting you trust, put a CDN in front of it so a traffic spike does not take the origin with it, keep backups running automatically, and renew domains and SSL certificates long before the expiry date rather than on it. Ship releases in stages so a bad one can be pulled back in minutes. Then monitor continuously from more than one location, because an outage lasts from the moment it starts until the moment somebody finds out, and that second half is the part you control.
Usually. Response times creep up, requests start timing out here and there, the share of 5xx responses climbs, memory or CPU sits near the ceiling, and a certificate edges toward its expiry date. None of that looks dramatic on its own, which is exactly why it gets missed. Reading response time as a trend line rather than a single number is what turns it into a warning you can act on.
Yes. Pulsetic sends alerts by email and webhooks on every plan, and by SMS, WhatsApp, phone call, Slack, Microsoft Teams and Telegram from the Solo plan, so it reaches whoever is on call in whatever they already have open. A webhook can also hand the alert to PagerDuty. Before any of that fires, a second location has to confirm the failure. One check failing from one node is far more often a network hiccup than an outage, and nobody should be woken up for it.
Yes. On every plan, a public status page on your own domain shows visitors the live status of the monitors you put on it. From the Solo plan you can add your colors and logo, post updates on what is broken and what you are doing about it, and let visitors subscribe by email. Those email updates are often the difference between a handful of support tickets and a hundred. Saying nothing during an outage costs more trust than the outage itself.
It can. If Googlebot keeps hitting 5xx errors, it may drop the affected pages from results until the site answers properly again, and a long outage chips away at the page-experience signals tied to availability and speed. A brief blip served as a 503 is generally harmless. Repeated or extended downtime is not, and by the time rankings move, the lost orders have usually cost more than the lost positions.
Yes. Pulsetic keeps every incident, response time, and uptime percentage for your plan's history window: 3 months on the free plan, a year on Solo and Team, and 5 years on Organization. Over that window the patterns surface on their own: the failures that only happen at peak traffic, or the ones that always follow a release. It is also what you point at when a customer asks whether you met the SLA, rather than reconstructing the month from memory and Slack scrollback.
Of the 2,201,561 outages Pulsetic confirmed on monitored endpoints over the last 12 months, 46% ended in under 5 minutes and 90% within an hour, as timed by each monitor’s own checks. If a site is down for everyone, retrying in a few minutes is a reasonable first step.
Source: The State of Uptime 2026, figures as of .
Trusted by teams at companies around the world
Stay online, all the time, with Pulsetic's uptime prime.
By Designmodo
Designmodo Inc. 169 Madison Ave, #79627, New York, NY 10016, United States
Copyright © 2010-2026. Pulsetic® is a registered trademark.