API Monitoring for Your Endpoints

Pulsetic is how developers make sure their API endpoints return the right status codes and stay fast. Checks run from 15 locations worldwide and alerts reach you the moment a check fails.

* No credit card required

Made for You

  • Catch failing endpoints before users do

    Pulsetic checks your endpoints from 15 monitoring locations worldwide and flags unexpected status codes the moment a check fails. You hear about a broken API from an alert, not from a support ticket.

  • Validate responses, not just uptime

    A 200 status code doesn’t guarantee a correct payload. Keyword monitoring checks the response body for text that should be there, so empty responses and hidden error messages still trigger an alert.

  • Alerts where your team lives

    Get notified by email, SMS, phone call, Telegram, Slack, Discord or Microsoft Teams, or wire alerts into your own tooling with Zapier and webhooks. However your on-call works, the alert lands where someone will see it.

Trusted by teams at companies around the world

"Pulsetic made monitoring something I barely think about anymore. The interface is clean and the tracking is real-time, so I can glance at my site’s performance and get back to work."

Koen Kanters
Koen Kanters

Senior Software Engineer at ASML

"Pulsetic is easy-to-use and simple to get started. As an agency, I like that it includes unlimited status pages, because I can create one for each of my clients. Pulsetic includes every alert channel that I want, and advanced settings that give me greater confidence in the uptime. I can require that a response include certain text and respond within a certain timeframe in order for a site to be considered online. This gives me assurance that we would be notified if there were major performance issues or a bad deployment that made the site unusable. These features come with every paid plan, so our monthly bill is predictable. The API is a huge bonus on the teams plan. We have used it to add maintenance windows for certain monitors automatically based on events that happen in other software we use."

Christopher Morbitzer

CEO at NorthBuilt

"Pulsetic’s monitoring is easy to set up via their super clean, user-friendly UI. I was up and running within only a few minutes. A helpful knowledge base is available for webmasters to refer to if needed. Pulsetic’s pricing is also some of the most competitive in the industry. I highly recommend them for emerging and established agencies alike."

Scott Werley
Scott Werley

Owner at Sporulate Design

"Pulsetic is easy to set up and integrate. You don’t need much time to get it running. The interface is clear and simple. It’s easy to see what’s going on at a glance. The design looks great, too. I had no trouble finding what I needed and monitoring my sites is straightforward. If you want a simple tool that works well, Pulsetic is a good choice."

Aryo Sayogha
Aryo Sayogha

CEO at MBDC Media

"The monitoring tool we’ve been waiting for. Super easy to set up monitoring, customizable status page design, and access to notifications across Slack, email and SMS. Pulsetic is awesome."

Andrei Negrau
Andrei Negrau

CEO at Siena AI

"Tens of thousands of business owners from around the world rely on our service, and Pulsetic is the best platform there is to ensure we communicate any downtimes clearly and swiftly to our customers to avoid panic and disappointment. Getting setup on Pulsetic not only been smooth and easy but super joyful too, the design is stunning and customisable unlike any other monitoring platform we’ve used."

Leo Bassam
Leo Bassam

Founder, CEO at Plutio

"Pulsetic cut down our uptime monitoring work a lot. We automated uptime tracking and SLA reporting, which took a chunk of manual effort out of our monthly and annual reports. The Slack and email alerts let the team jump on problems quickly, and the API is what really sold us, since we point a dedicated health-check endpoint at it and pull uptime data straight into our internal workflows."

Mariana Kodama
Mariana Kodama

Treasurer, Fundacion Jorge Luis Borges

"There’s an easy way for you to monitor your online project. After all the hard work you have put into going live, you want to make sure that things keep running smoothly while you focus on the next project."

Chris Kalmar
Chris Kalmar

Founder at nineLemon

"Pulsetic is fast and genuinely easy to use. The UI is clean and has the features we actually needed, the status pages look good, and being able to route alerts to several channels was a real plus for us."

Akis Laopodis
Akis Laopodis

Founder at Qurioos

"Pulsetic helps us monitor all of our websites and webapps over at Pairing.dev. Before we used it, we had no idea how often services (e.g. heroku) were offline. Now we have complete control over it."

Till Carlos
Till Carlos

Founder at Pairing.dev

"Using Pulsetic is a big win for us! Our dev team can now deliver faster, with zero time spent monitoring our website uptime. Plus the interface is great and analytics proper."

Razvan Popescu
Razvan Popescu

Head of Marketing at AbstractAPI

What You Can Monitor on an API

  • REST and GraphQL endpoints

    HTTP and HTTPS monitors request any endpoint URL and alert on unexpected status codes, whether it serves REST, GraphQL or plain JSON.

  • Response body content

    Keyword monitoring checks the payload for text that should or shouldn’t be present, so a healthy status code with a broken response still raises an alert.

  • Databases and backing services

    TCP and port monitors confirm the services behind your API are accepting connections: databases, caches, message brokers and anything else listening on a port.

  • Scheduled jobs and queue workers

    Heartbeat monitors expect a regular ping from your code, so a silent crash in a scheduled task gets noticed. Cron job monitoring covers the details.

  • SSL certificates on API domains

    An expired certificate takes an API down as surely as a crashed server. SSL monitoring reminds you 14, 7 and 1 days before a certificate expires.

  • Response times and history

    Every check records how fast your endpoint answered. Historical uptime and logs show when an API started slowing down, not just when it went offline.

Looking for Pulsetic’s own REST API to manage monitors programmatically? See the API documentation page.

How Does the API Monitor Work?

You don’t need to be technical to use Pulsetic; we’ve made it quick and simple for everyone.

  • Sign up for a free Pulsetic account and click «add monitor».

  • Paste your endpoint URLs and set how often you’d like us to check them.

  • Get automated notifications the moment an endpoint stops responding correctly.

  • For Developers

    Catch failing endpoints and slow responses in the APIs your apps depend on, before users open bug reports.

  • For DevOps Teams

    Monitor API health from 15 locations worldwide and route alerts straight into your on-call workflow.

  • For Startup Teams

    Keep the API behind your product reliable as you grow, without building monitoring infrastructure yourself.

  • For IT Managers

    Track the uptime of internal and third-party APIs and prove reliability with reports and historical data.

  • Bring in your whole team.

    Need access for more than one person? Pulsetic is for you. Easily manage access controls with specific rights and permissions for individual users, so you can collaborate without compromising on security.

  • Team access
  • API
  • Connect your API for even more flexibility.

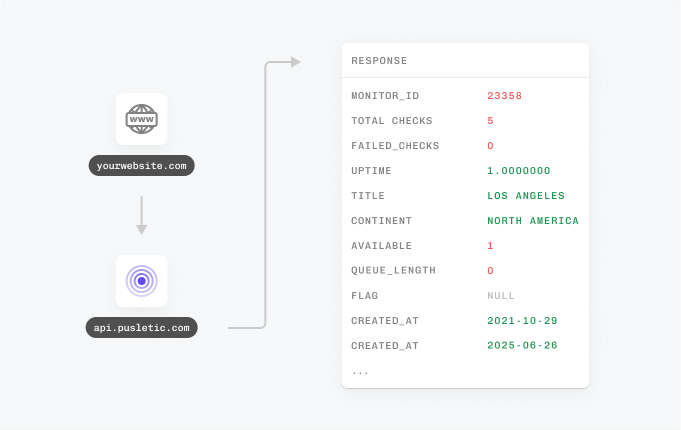
    With Pulsetic’s API, you’ve got complete control: you can add custom statistics, monitors & automations, create bespoke rules and maintain granular control over who can access or modify monitoring information. Best suited for developers in scale-up or large enterprises.

FAQ: API Monitoring

  • What is API monitoring?

    API monitoring sends regular requests to your API endpoints to confirm they respond correctly. A monitor checks the status code, the response time and optionally the response content, and alerts you the moment an endpoint goes down or starts returning errors.

  • How is API monitoring different from website monitoring?

    Website monitoring checks whether a page loads for visitors. API monitoring targets the endpoints behind your applications: it verifies status codes, response times and payloads, which is what your mobile apps, frontends and integration partners actually depend on.

  • How often does Pulsetic check my API?

    Check intervals are configurable per monitor, so you can match the frequency to how critical each endpoint is. Every check runs from Pulsetic’s 15 monitoring locations worldwide, which helps you tell real outages apart from local network problems.

  • Can I monitor authenticated API endpoints?

    Yes. Monitors include advanced request settings, so you can send the headers your endpoint expects, such as an API key or bearer token, and check endpoints that sit behind authentication.

  • Can Pulsetic validate the response body?

    Yes. Keyword monitoring checks the response content for text that should or should not be present, so you catch empty payloads, error messages and broken responses that still return a 200 status code.

  • Can I get a status page for my API?

    Yes. Pulsetic includes public and private, password-protected status pages with your own custom domain, logo and colors, so you can show your API’s uptime to customers or keep it internal for your team.

  • What alerts are available when my API goes down?

    Pulsetic sends alerts by email, SMS, phone call, Telegram, Slack, Discord and Microsoft Teams, and connects to everything else through Zapier and webhooks, so downtime notifications reach your team wherever they already work.

  • Is this the same as Pulsetic’s REST API?

    No. This page is about monitoring your own API endpoints. Pulsetic’s REST API is a separate feature with token authentication that lets you create and manage monitors programmatically, and it has its own documentation page.