See How Your Website Really Performs for Real Visitors

Synthetic checks tell you if your site is up. Real User Monitoring tells you how it feels. See real page load times, Core Web Vitals, the JavaScript and network errors your visitors hit, and who is on your site right now, sliced by page, country, city, browser and device.

Start monitoring real users free *

* No credit card required

Know exactly what your visitors experience

  • Real page load times, not lab numbers

    Every visitor's pageview reports DNS, connection, TTFB and full load timing. See p50/p75/p95 percentiles over time and spot regressions the moment they ship.

  • Core Web Vitals from the field

    LCP, CLS and INP, the field data Google uses for rankings, plus FCP, all measured on real devices. See the share of visits rated good, needs improvement or poor on every page.

  • Catch the errors real users hit

    Every JavaScript exception and failed request, with the full stack trace, the pages affected and an errors-per-100-views rate. Fix what is actually breaking, not only what you can reproduce.

  • Breakdowns that point to the fix

    Slice performance by page, country, city, browser, OS, device and referrer. Find out it is only slow on mobile in one region, before your customers tell you.

  • See who is on your site right now

    A live view of current visitors updating by the minute, with the pages they are on and where they came from. Watch a launch or a traffic spike as it happens.

Trusted by teams at companies around the world

See your real users in Pulsetic

Page load times, Core Web Vitals, errors and live visitors from real people, right in your dashboard.

  • Every pageview, measured

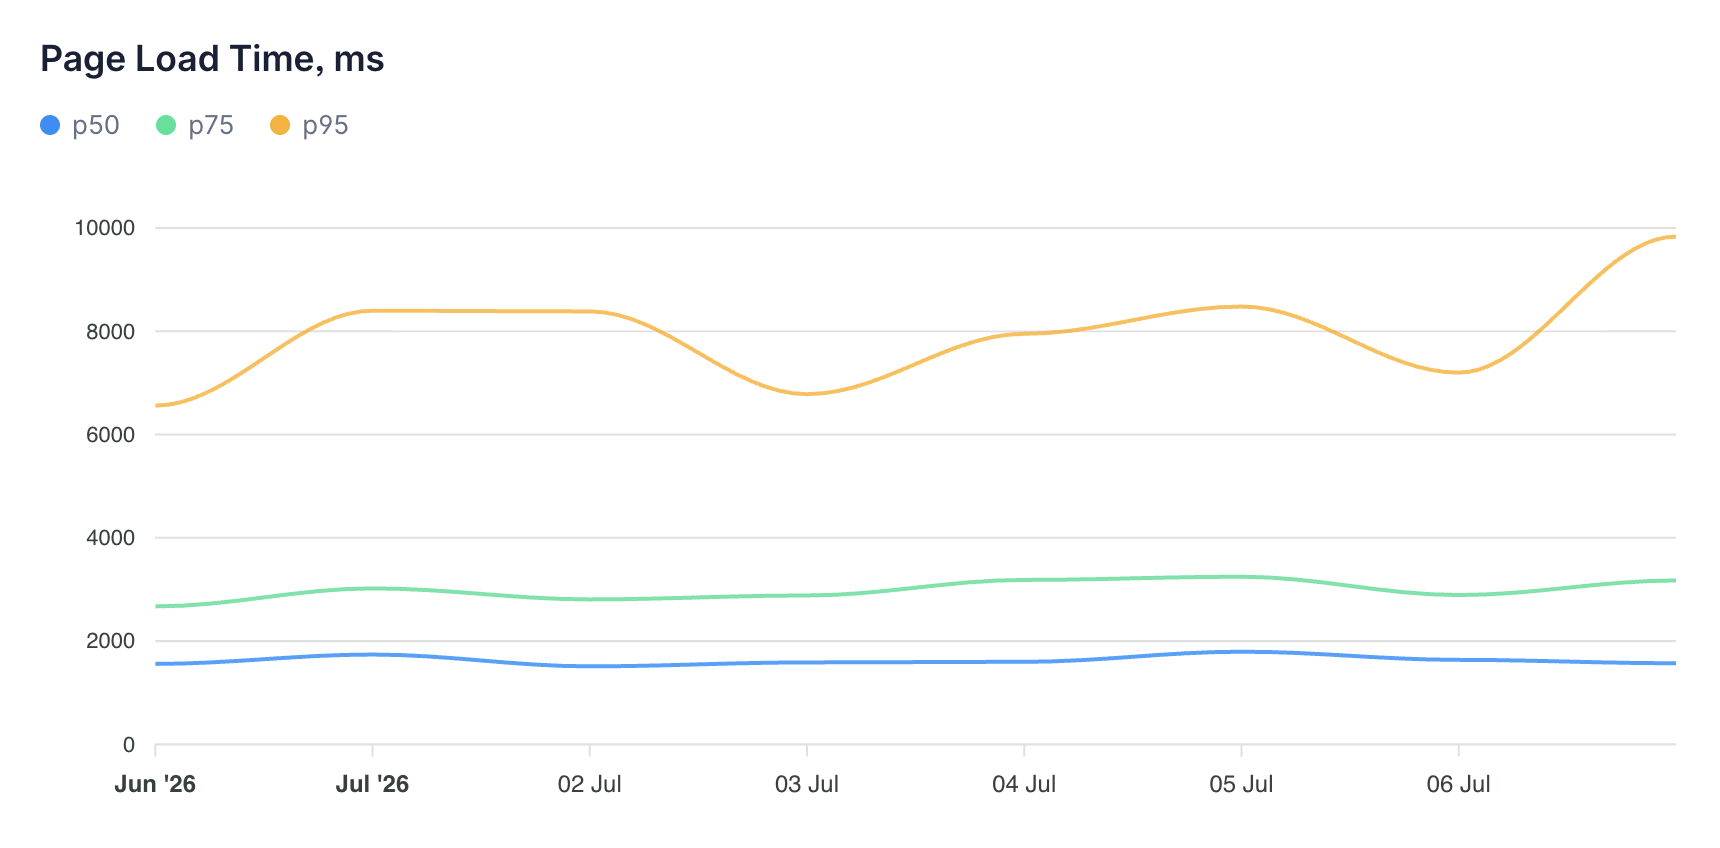
    The RUM dashboard turns real traffic into a live performance picture: page views, load-time percentiles and error counts for any period you pick, updating as visitors browse.

    p50, p75 and p95 load times, charted over time

    Page views and JS or HTTP error counts at a glance

    Spot a regression the moment a release ships

  • Every pageview, measured - Pulsetic Real User Monitoring
  • The numbers Google ranks you on

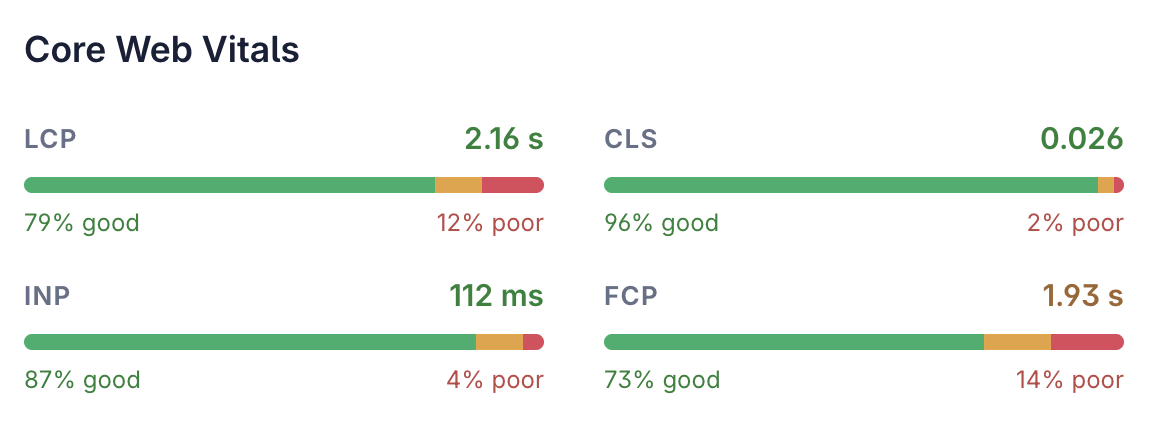
    Core Web Vitals are measured in the field, on your visitors' real devices and networks. Every page gets a rating against Google's thresholds, so you know exactly what to fix first.

    LCP, CLS and INP, plus FCP, at the 75th percentile

    The share of visits rated good, needs improvement or poor

    The same field data Google uses for rankings

  • The numbers Google ranks you on - Pulsetic Real User Monitoring
  • Find exactly where it's slow

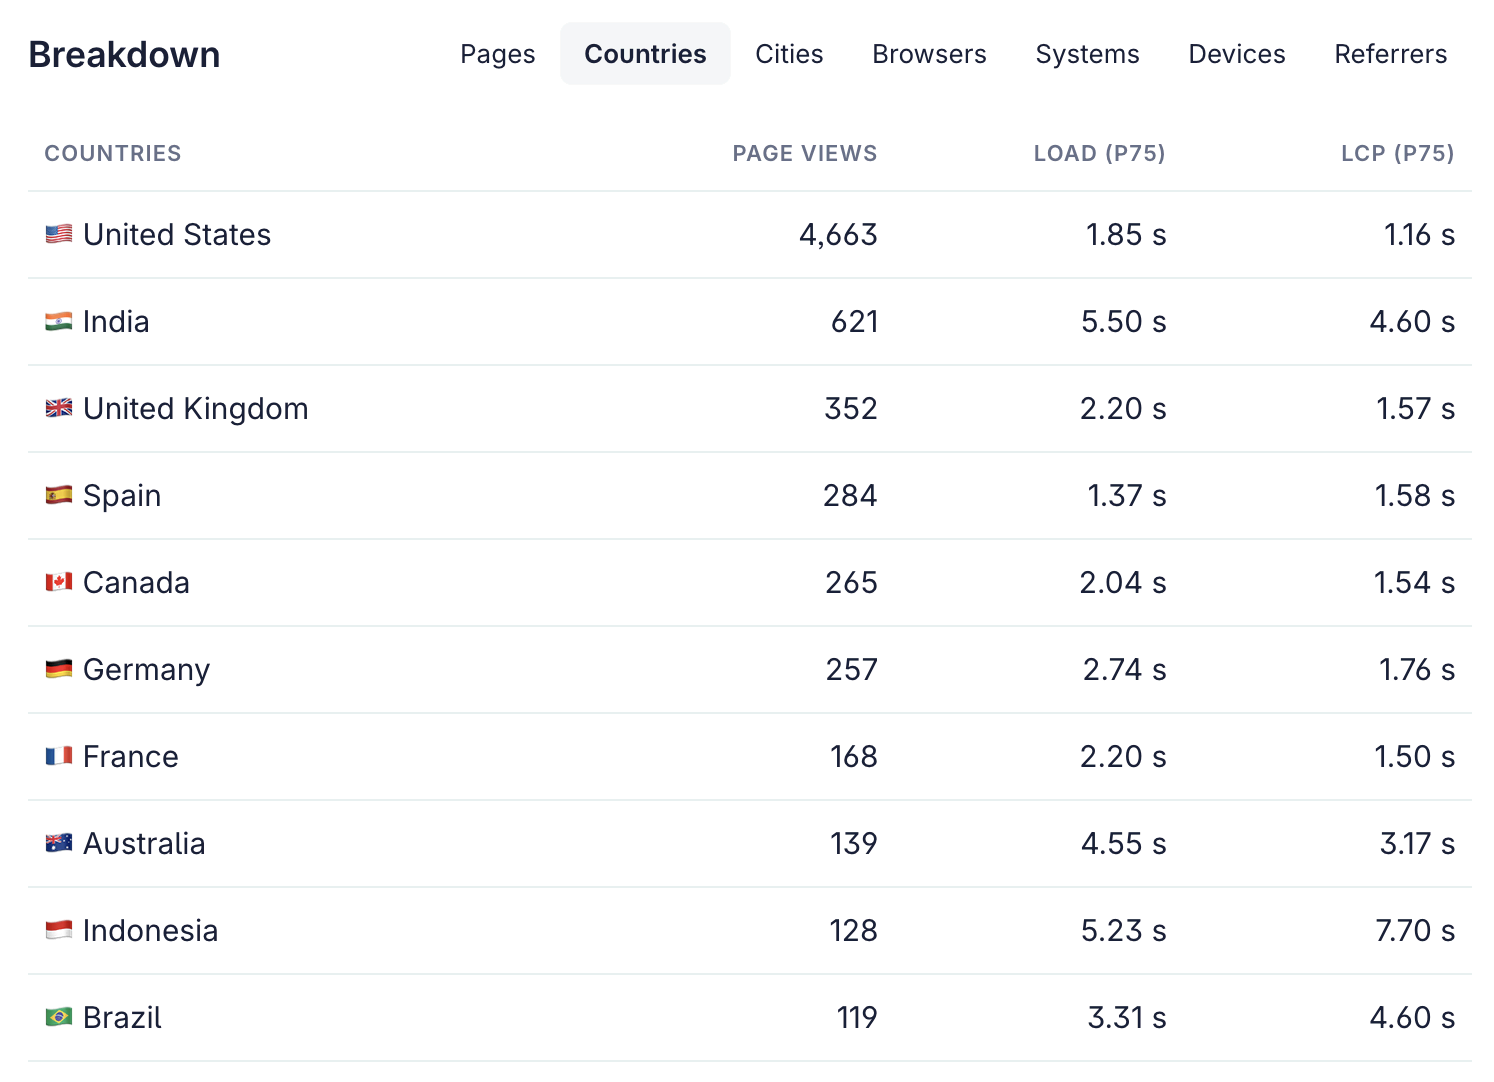
    Slice every metric by page, country, city, browser, device and referrer. When a page is fast on desktop in Berlin but slow on mobile in Mumbai, the breakdowns point straight at it.

    Compare load times across countries, cities and devices

    Rank pages by traffic or by slowness

    See which browsers and referrers drag performance down

  • Find exactly where it's slow - Pulsetic Real User Monitoring
  • Errors, caught in the act

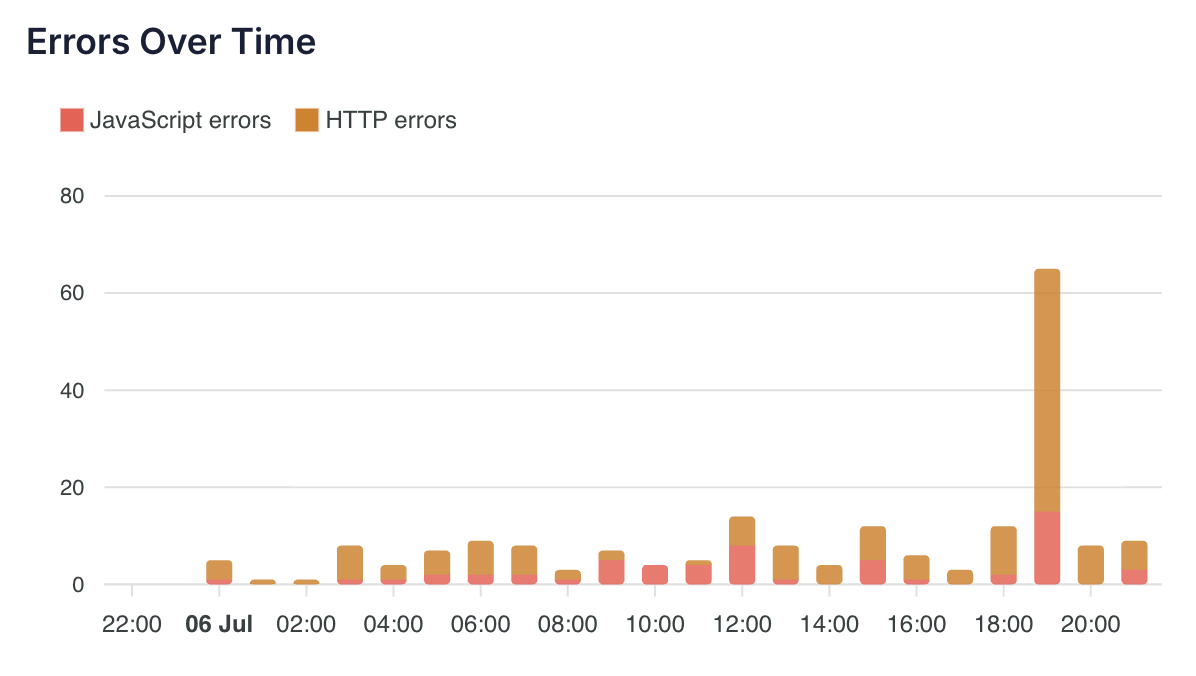
    Pulsetic RUM records the JavaScript exceptions and failed network requests your real visitors hit, with the full stack trace and the pages affected, so you can reproduce and fix them fast.

    Full stack traces, occurrence counts and pages affected

    HTTP and third-party request failures, by status code

    An errors-per-100-views rate to track reliability over time

  • Errors, caught in the act - Pulsetic Real User Monitoring
Start monitoring real users free

No credit card required

"Pulsetic made monitoring something I barely think about anymore. The interface is clean and the tracking is real-time, so I can glance at my site’s performance and get back to work."

Koen Kanters
Koen Kanters

Senior Software Engineer at ASML

"Pulsetic is easy-to-use and simple to get started. As an agency, I like that it includes unlimited status pages, because I can create one for each of my clients. Pulsetic includes every alert channel that I want, and advanced settings that give me greater confidence in the uptime. I can require that a response include certain text and respond within a certain timeframe in order for a site to be considered online. This gives me assurance that we would be notified if there were major performance issues or a bad deployment that made the site unusable. These features come with every paid plan, so our monthly bill is predictable. The API is a huge bonus on the teams plan. We have used it to add maintenance windows for certain monitors automatically based on events that happen in other software we use."

Christopher Morbitzer

CEO at NorthBuilt

"Pulsetic’s monitoring is easy to set up via their super clean, user-friendly UI. I was up and running within only a few minutes. A helpful knowledge base is available for webmasters to refer to if needed. Pulsetic’s pricing is also some of the most competitive in the industry. I highly recommend them for emerging and established agencies alike."

Scott Werley
Scott Werley

Owner at Sporulate Design

"Pulsetic is easy to set up and integrate. You don’t need much time to get it running. The interface is clear and simple. It’s easy to see what’s going on at a glance. The design looks great, too. I had no trouble finding what I needed and monitoring my sites is straightforward. If you want a simple tool that works well, Pulsetic is a good choice."

Aryo Sayogha
Aryo Sayogha

CEO at MBDC Media

"The monitoring tool we’ve been waiting for. Super easy to set up monitoring, customizable status page design, and access to notifications across Slack, email and SMS. Pulsetic is awesome."

Andrei Negrau
Andrei Negrau

CEO at Siena AI

"Tens of thousands of business owners from around the world rely on our service, and Pulsetic is the best platform there is to ensure we communicate any downtimes clearly and swiftly to our customers to avoid panic and disappointment. Getting setup on Pulsetic not only been smooth and easy but super joyful too, the design is stunning and customisable unlike any other monitoring platform we’ve used."

Leo Bassam
Leo Bassam

Founder, CEO at Plutio

"Pulsetic cut down our uptime monitoring work a lot. We automated uptime tracking and SLA reporting, which took a chunk of manual effort out of our monthly and annual reports. The Slack and email alerts let the team jump on problems quickly, and the API is what really sold us, since we point a dedicated health-check endpoint at it and pull uptime data straight into our internal workflows."

Mariana Kodama
Mariana Kodama

Treasurer, Fundacion Jorge Luis Borges

"There’s an easy way for you to monitor your online project. After all the hard work you have put into going live, you want to make sure that things keep running smoothly while you focus on the next project."

Chris Kalmar
Chris Kalmar

Founder at nineLemon

"Pulsetic is fast and genuinely easy to use. The UI is clean and has the features we actually needed, the status pages look good, and being able to route alerts to several channels was a real plus for us."

Akis Laopodis
Akis Laopodis

Founder at Qurioos

"Pulsetic helps us monitor all of our websites and webapps over at Pairing.dev. Before we used it, we had no idea how often services (e.g. heroku) were offline. Now we have complete control over it."

Till Carlos
Till Carlos

Founder at Pairing.dev

"Using Pulsetic is a big win for us! Our dev team can now deliver faster, with zero time spent monitoring our website uptime. Plus the interface is great and analytics proper."

Razvan Popescu
Razvan Popescu

Head of Marketing at AbstractAPI

Set up in under a minute

  • 1. Add your website

    Create a site in your Pulsetic dashboard. Add as many websites as you want. RUM is metered by traffic, not by site.

  • 2. Paste the snippet

    Copy one tiny async script tag (<4 KB) into your site's head. No cookies, no impact on your load time.

  • 3. Watch real data flow in

    Page views, load percentiles, Core Web Vitals and any errors start appearing within minutes, broken down by page, country, city, browser and device.

Frequently asked questions

  • What is Real User Monitoring (RUM)?

    Real User Monitoring measures your website's performance from the browsers of your actual visitors. Instead of synthetic tests from data centers, RUM shows real page load times, Core Web Vitals, errors and page views as experienced by real people on real devices and networks.

  • How do I add Real User Monitoring to my website?

    Add your website in Pulsetic, copy the small JavaScript snippet and paste it into the head of your site. Data from real visitors starts appearing in your dashboard within minutes. No code changes required.

  • What are Core Web Vitals and why do they matter?

    Core Web Vitals (LCP, INP and CLS) are Google's user-experience metrics that influence search rankings and conversion rates. Pulsetic RUM tracks all three from real visitors, along with First Contentful Paint, and shows the share of visits rated good, needs improvement or poor on each page.

  • Does Pulsetic RUM track JavaScript errors?

    Yes. RUM captures the JavaScript exceptions and failed HTTP requests your real visitors hit, with the full stack trace, the source file and line, how many times each one happened and which pages it affected. It also reports an errors-per-100-views rate so you can track reliability as your traffic grows.

  • Can I see visitors in real time?

    Yes. The realtime view shows how many people are on your site right now, updating by the minute, along with the pages they are viewing and the sources they came from. It is the fastest way to watch a launch or a traffic spike as it happens.

  • Does the RUM script slow down my website?

    No. The Pulsetic RUM tracker is a tiny script (under 4 KB) that loads asynchronously and sends a couple of lightweight beacons per pageview — navigation timings once the page loads and Core Web Vitals when the visitor leaves — so it has no measurable impact on your site's performance.

  • How is RUM different from uptime monitoring?

    Uptime monitoring checks your website from Pulsetic's global network to detect downtime. Real User Monitoring measures the experience of your actual visitors: how fast pages load for them, on their devices, browsers and networks. Together they give you the full picture.

  • How is Real User Monitoring priced?

    Every plan includes a monthly allowance of RUM requests (one request per pageview). Monitor unlimited websites. If you need more traffic, you can buy additional request packs at any time.