See your website at the exact moment it went down

When a monitor detects downtime, Pulsetic captures a screenshot of the page at the moment of failure. No more guessing what "down" looked like: open the incident and see exactly what your visitors saw.

A status code tells you it broke. A screenshot tells you how.

  • Diagnose outages without reproducing them

    By the time you open a browser, the site is often back. The screenshot preserves the failure as it happened: the error page, the blank screen, the misbehaving layout. You start from evidence, not from a guess about what a 500 might have looked like.

  • Know whose problem it is

    Your server's error page, your CDN's error page and your host's suspended-account notice all count as downtime, and each one points at a different fix. One look at the capture usually settles whether you are debugging your code, opening a ticket with your host, or waiting out a provider outage.

  • Keep visual proof of every incident

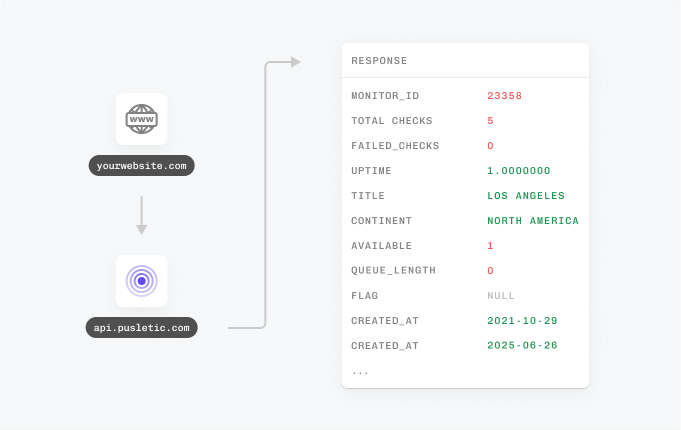
    Each downtime event keeps its screenshot alongside the response details. When a client, a manager or a provider asks what actually happened last Tuesday at 3 a.m., you show them the page, not a log line that needs interpreting.

Trusted by teams at companies around the world

"Pulsetic made monitoring something I barely think about anymore. The interface is clean and the tracking is real-time, so I can glance at my site’s performance and get back to work."

Koen Kanters
Koen Kanters

Senior Software Engineer at ASML

"Pulsetic is easy-to-use and simple to get started. As an agency, I like that it includes unlimited status pages, because I can create one for each of my clients. Pulsetic includes every alert channel that I want, and advanced settings that give me greater confidence in the uptime. I can require that a response include certain text and respond within a certain timeframe in order for a site to be considered online. This gives me assurance that we would be notified if there were major performance issues or a bad deployment that made the site unusable. These features come with every paid plan, so our monthly bill is predictable. The API is a huge bonus on the teams plan. We have used it to add maintenance windows for certain monitors automatically based on events that happen in other software we use."

Christopher Morbitzer

CEO at NorthBuilt

"Pulsetic’s monitoring is easy to set up via their super clean, user-friendly UI. I was up and running within only a few minutes. A helpful knowledge base is available for webmasters to refer to if needed. Pulsetic’s pricing is also some of the most competitive in the industry. I highly recommend them for emerging and established agencies alike."

Scott Werley
Scott Werley

Owner at Sporulate Design

"Pulsetic is easy to set up and integrate. You don’t need much time to get it running. The interface is clear and simple. It’s easy to see what’s going on at a glance. The design looks great, too. I had no trouble finding what I needed and monitoring my sites is straightforward. If you want a simple tool that works well, Pulsetic is a good choice."

Aryo Sayogha
Aryo Sayogha

CEO at MBDC Media

"The monitoring tool we’ve been waiting for. Super easy to set up monitoring, customizable status page design, and access to notifications across Slack, email and SMS. Pulsetic is awesome."

Andrei Negrau
Andrei Negrau

CEO at Siena AI

"Tens of thousands of business owners from around the world rely on our service, and Pulsetic is the best platform there is to ensure we communicate any downtimes clearly and swiftly to our customers to avoid panic and disappointment. Getting setup on Pulsetic not only been smooth and easy but super joyful too, the design is stunning and customisable unlike any other monitoring platform we’ve used."

Leo Bassam
Leo Bassam

Founder, CEO at Plutio

"Pulsetic cut down our uptime monitoring work a lot. We automated uptime tracking and SLA reporting, which took a chunk of manual effort out of our monthly and annual reports. The Slack and email alerts let the team jump on problems quickly, and the API is what really sold us, since we point a dedicated health-check endpoint at it and pull uptime data straight into our internal workflows."

Mariana Kodama
Mariana Kodama

Treasurer, Fundacion Jorge Luis Borges

"There’s an easy way for you to monitor your online project. After all the hard work you have put into going live, you want to make sure that things keep running smoothly while you focus on the next project."

Chris Kalmar
Chris Kalmar

Founder at nineLemon

"Pulsetic is fast and genuinely easy to use. The UI is clean and has the features we actually needed, the status pages look good, and being able to route alerts to several channels was a real plus for us."

Akis Laopodis
Akis Laopodis

Founder at Qurioos

"Pulsetic helps us monitor all of our websites and webapps over at Pairing.dev. Before we used it, we had no idea how often services (e.g. heroku) were offline. Now we have complete control over it."

Till Carlos
Till Carlos

Founder at Pairing.dev

"Using Pulsetic is a big win for us! Our dev team can now deliver faster, with zero time spent monitoring our website uptime. Plus the interface is great and analytics proper."

Razvan Popescu
Razvan Popescu

Head of Marketing at AbstractAPI

How do Monitor Screenshots work?

Nothing to install and nothing to change on your website. The capture happens from the outside, the same way your visitors reach the page.

  • Add your website to Pulsetic and let the uptime checks run.

  • When a check fails, Pulsetic captures the page at the moment of the outage.

  • Open the downtime event in your dashboard and see the page exactly as visitors saw it.

"Down" is not one thing

Every one of these reads as a failed check in any monitoring tool. The screenshot is what tells them apart, and each one has a different next step.

  • An error page from your own application

    A stack trace, a framework error screen, or your own styled 500 page. The problem is in your code or your database, and the screenshot often narrows it to a specific page element before you have opened the logs.

  • A gateway error from your CDN or proxy

    The distinctive error pages of Cloudflare, your load balancer or your reverse proxy mean the edge answered but your origin did not. That is a very different investigation from an application bug.

  • A notice from your hosting provider

    Suspended account, exceeded resource limits, expired domain parking. These pages mean your ticket goes to the provider, and the screenshot is exactly the evidence to attach to it.

  • A blank or broken page that "loads" fine

    Sometimes the server responds and the page is still unusable: a white screen, missing styles, a JavaScript crash. The capture shows what rendered, which no status code can tell you.

  • For DevOps Teams

    Skip the reproduction step: open the incident and see whether the failure was your app, the edge, or the host.

  • For Webmasters

    Show clients exactly what their site looked like during an outage, with evidence attached to every incident.

  • For Ecommerce Managers

    See whether shoppers hit an error page or a blank checkout, and know what the outage actually cost you.

  • For Business Owners

    Get a picture of the problem you can act on, even if you never read a server log.

  • Bring in your whole team.

    Need access for more than one person? Pulsetic is for you. Easily manage access controls with specific rights and permissions for individual users, so you can collaborate without compromising on security.

  • Team access
  • API
  • Connect your API for even more flexibility.

    With Pulsetic’s API, you’ve got complete control: you can add custom statistics, monitors & automations, create bespoke rules and maintain granular control over who can access or modify monitoring information. Best suited for developers in scale-up or large enterprises.

FAQ: Monitor Screenshots

  • What are monitor screenshots?

    A visual record of your website at the exact moment a monitor detected downtime. When a check fails, Pulsetic captures what the page looked like and attaches the screenshot to the downtime event, so you can see precisely what a visitor saw: an error page, a blank screen, a hosting provider's placeholder, or a half-loaded layout.

  • Why is a screenshot of the failure useful?

    Because a status code rarely tells the whole story. A 500 from your server, an error page from your CDN, and a suspended-account notice from your host all read as downtime, but each points at a different fix. Seeing the actual page removes the guesswork and usually tells you whose problem it is before you open a single log.

  • When is a screenshot taken?

    When a monitor goes down. The capture happens at the moment of the failed check, so the image reflects the outage as it happened rather than the recovered page you see once you get to a browser.

  • Where do I find the screenshots?

    On the downtime event itself, in your Pulsetic dashboard. Each incident keeps its screenshot alongside the response details, so when you review an outage later you see what the page looked like at the time, not a reconstruction from memory.

  • How long are screenshots stored?

    For 90 days. Each capture stays attached to its downtime event for 90 days after the outage, which covers the window when you are most likely to review an incident, write it up, or attach the evidence to a ticket with a client or a hosting provider.

  • Do I need to change my website to use this?

    No. Nothing is installed on your site and no code changes are needed. The screenshot is captured from the outside, the same way your visitors reach the page, which is exactly why it shows what they actually experienced.