Ask your monitoring. It answers back.

Pulsetic has an AI assistant built into your dashboard. It reads your live monitors, incidents, domains and real-visitor data, and with your approval, it can act on them.

Ask. Diagnose. Act.

  • Ask in your own language

    Write in whatever language you think in and the assistant answers in the same one, whether you're asking about fleet status, uptime math, downtime history or account-wide analytics.

  • Find out why, not just what

    Ask why a monitor is down and get the error, the HTTP response code and which monitoring location saw the failure, not a red dot.

  • Act, with your approval

    Create monitors, pause them for a deploy, open an incident, schedule maintenance. Every change stops for your Confirm or Cancel.

Trusted by teams at companies around the world

  • Ask anything about your uptime

    Reads run immediately, straight from your live account data. Anything that changes something waits for your go-ahead.

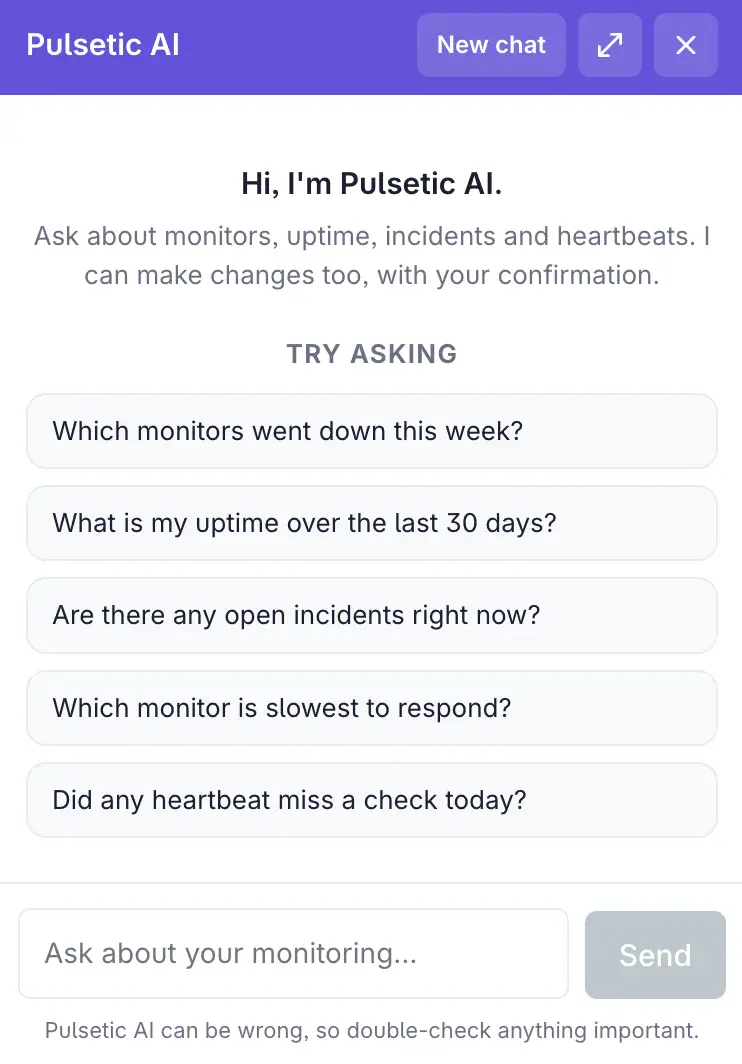
  • The Pulsetic AI chat panel open in the dashboard, with the greeting "Hi, I'm Pulsetic AI", five starter prompts such as "Which monitors went down this week?", and a message box.

Answered instantly

  • Instant fleet status

    Current status, URL, uptime percentage and response time for every monitor on the account, in one sentence instead of a dashboard grid to scan.

    "Is anything down right now?"

  • Uptime math on demand

    Uptime percentage, total downtime, incident count and average response time for any monitor over 1, 7, 30 or 90 days. No export, no report to build.

    "Give me uptime and average response time for checkout over the last 7 days."

    Free-form date ranges go through account analytics.

  • Account-wide analytics

    Aggregate questions over a date range you choose, filtered by continent, region or a subset of monitors, grouped by monitor, region or day. Reporting work, answered in a sentence.

    "How was our uptime in Europe last week, grouped by monitor?"

    Capped at 93 days per question. If archived data can't be reached, the answer is flagged partial rather than presented as complete.

  • Downtime and event history

    Every online and offline event for a monitor over a date range, or the total downtime it accumulated over the last N days.

    "How much total downtime did the API have in the last 30 days?"

    Event lists default to 7 days; downtime totals default to 30 days.

  • Account-wide event feed

    Everything that went offline and came back, across all monitors and heartbeats, in one chronological timeline.

    "Show me everything that went down or came back in the last 48 hours."

    Defaults to the last 7 days; ask for a wider window explicitly.

  • Change history and audit

    What was created, updated or deleted across monitors and heartbeats, filterable by resource type and date range. Answers "did someone change this?" before you debug the wrong thing.

    "What changed on our monitors in the last week?"

    Covers monitors and heartbeats; defaults to the last 30 days.

Done with your approval

  • Create, edit, pause, resume, delete monitors

    Spin up HTTP, TCP or ICMP monitors by describing what you want checked, then rename them, change the URL or check interval, or delete them from the same conversation.

    "Add an HTTP monitor for status.example.com, checked every minute."

    Your plan's monitor limit is enforced and stated plainly if you hit it.

  • Cron and heartbeat management

    Create heartbeat checks, change the expected interval or grace period, pause, resume or delete them. Background jobs get the same depth as web endpoints.

    "Create a heartbeat for the nightly backup, expected every 24 hours with a 30-minute grace period."

    Missed-check alerts follow the heartbeat's existing notification settings.

  • Incident management

    Open an incident with an initial update, post follow-ups, then resolve it with a closing message. From "why is checkout down?" to a published update in one conversation.

    "Open an incident for the checkout outage and post an update."

    Incidents attach to status pages rather than directly to monitors.

  • Status page administration

    Create status pages, change their configuration and monitor lineup, attach a custom domain, or delete a page. Setting a custom domain triggers SSL provisioning automatically.

    "Put the API and checkout monitors on our public status page."

    Monitors and heartbeats you don't own are dropped rather than attached. Deleting a page also removes its incidents and maintenance windows; the assistant says so before you confirm.

  • Scheduled maintenance windows

    Schedule a maintenance window on a status page, or delete one, so planned work is announced to customers in the time it takes to type the sentence.

    "Schedule maintenance on the status page for Saturday 02:00-04:00 UTC."

  • Two changes, handled one at a time

    Ask for two changes at once and the assistant proposes the first, then moves to the second only after you've decided. No batch of changes ever rides on a single yes.

    "Pause the staging monitor and delete the old test one."

    Pending confirmations expire after 15 minutes.

  • Why it's down, not just that it's down.

    Ask why a monitor is down and get the actual failure detail, plus the latest check's time, response time and status. Real error strings and real geography are often the difference between "our app is broken" and "one region can't reach us."

  • Why is checkout down?

    checkout-api has been down since 14:32 UTC.

    Reason: 504 Gateway Timeout, seen from the Frankfurt monitoring location.

    Latest check: 14:47 UTC, 3.1s response time, still failing.

    Answered from your live monitor data, not a guess.

Act, don't just ask

Every change starts as a proposal. The assistant spells out what will happen and waits for you.

  • Nothing changes without your explicit approval. All 34 actions go through the same gate.

  • The gate lives in the code, not in a prompt instruction that clever phrasing can talk around.

  • Every read and every action is scoped to your team owner's account. Nothing else.

Beyond uptime

Real user monitoring, domains, badges, tags and your monitoring IP allowlist, all in the same conversation.

Real user monitoring in chat

What your visitors actually experienced, asked the same way you'd ask a teammate. Everything RUM collects is a question away.

  • Real-visitor performance

    Pageviews, load-time percentiles, TTFB and Core Web Vitals over a date range, answered from real visitor data rather than a lab test.

    "What's our p75 load time this week?"

    92-day range cap; the default window is the last 7 days.

  • Timeseries and breakdowns

    Bucket any RUM metric by hour or day, or break it down by path, country, city, browser, OS, device or referrer, all in plain language.

    "Break down load time by country for the checkout page."

  • Realtime visitor snapshot

    Visitors in the last 5 minutes, uniques and pageviews over the last 30 minutes, a per-minute series, plus top pages and traffic sources.

    "How many people are on the site right now, and what are they looking at?"

  • JavaScript and HTTP errors

    Top JS errors and top HTTP errors from real sessions, with totals and an overall error rate. Catches breakage even when every uptime check is green.

    "What are the top JavaScript errors our visitors hit today?"

    92-day range cap.

  • RUM usage and quota

    RUM request usage against your plan limit for the current billing period, including an over-quota flag. Billing visibility without leaving the chat.

    "How much of our RUM quota have we used this month?"

    Counted per billing period, not per calendar month.

  • RUM site setup and control

    Create a RUM site and get the embed snippet back in chat, rename or re-domain it, enable or disable collection, or delete it.

    "Set up RUM for example.com and give me the snippet."

    Confirmation required. Deleting a site purges its collected data.

Everything else you monitor

  • Domain expiration and WHOIS

    List monitored domains with registrar, WHOIS status and expiration date. Add, rename, toggle alerts, pause, resume or delete WHOIS checks.

    "Which of our domains expire in the next 90 days?"

    Just-added domains may briefly show blanks until the WHOIS lookup completes.

  • Status badges

    List, inspect, create with sensible defaults, restyle or delete embed badges, with the ready-to-paste embed URL returned in chat.

    "Make an uptime badge for the API and give me the embed code."

    Creating, updating and deleting need a plan with customization enabled.

  • Tags and organization

    List tags with usage counts across monitors, heartbeats and domains. Create, rename or delete a tag, or set a resource's full tag set by name.

    "Tag every staging monitor with staging."

    Setting tags replaces a resource's tags rather than adding to them.

  • Monitoring IP allowlist

    The complete IPv4 and IPv6 source-address list for Pulsetic's checks, grouped by monitoring location, ready for a firewall or WAF allowlist.

    "Give me all your monitoring IPs so I can allowlist them."

    Matches the list published in the docs.

Already using AI tools of your own?

If you'd rather drive Pulsetic from Claude, ChatGPT, Cursor or Windsurf, the Pulsetic MCP server connects your own AI tools to your monitoring data.

Explore the MCP server

"Pulsetic made monitoring something I barely think about anymore. The interface is clean and the tracking is real-time, so I can glance at my site’s performance and get back to work."

Koen Kanters
Koen Kanters

Senior Software Engineer at ASML

"Pulsetic is easy-to-use and simple to get started. As an agency, I like that it includes unlimited status pages, because I can create one for each of my clients. Pulsetic includes every alert channel that I want, and advanced settings that give me greater confidence in the uptime. I can require that a response include certain text and respond within a certain timeframe in order for a site to be considered online. This gives me assurance that we would be notified if there were major performance issues or a bad deployment that made the site unusable. These features come with every paid plan, so our monthly bill is predictable. The API is a huge bonus on the teams plan. We have used it to add maintenance windows for certain monitors automatically based on events that happen in other software we use."
Christopher Morbitzer

CEO at NorthBuilt

"Pulsetic’s monitoring is easy to set up via their super clean, user-friendly UI. I was up and running within only a few minutes. A helpful knowledge base is available for webmasters to refer to if needed. Pulsetic’s pricing is also some of the most competitive in the industry. I highly recommend them for emerging and established agencies alike."

Scott Werley
Scott Werley

Owner at Sporulate Design

"Pulsetic is easy to set up and integrate. You don’t need much time to get it running. The interface is clear and simple. It’s easy to see what’s going on at a glance. The design looks great, too. I had no trouble finding what I needed and monitoring my sites is straightforward. If you want a simple tool that works well, Pulsetic is a good choice."

Aryo Sayogha
Aryo Sayogha

CEO at MBDC Media

"The monitoring tool we’ve been waiting for. Super easy to set up monitoring, customizable status page design, and access to notifications across Slack, email and SMS. Pulsetic is awesome."

Andrei Negrau
Andrei Negrau

CEO at Siena AI

"Tens of thousands of business owners from around the world rely on our service, and Pulsetic is the best platform there is to ensure we communicate any downtimes clearly and swiftly to our customers to avoid panic and disappointment. Getting setup on Pulsetic not only been smooth and easy but super joyful too, the design is stunning and customisable unlike any other monitoring platform we’ve used."

Leo Bassam
Leo Bassam

Founder, CEO at Plutio

"Pulsetic cut down our uptime monitoring work a lot. We automated uptime tracking and SLA reporting, which took a chunk of manual effort out of our monthly and annual reports. The Slack and email alerts let the team jump on problems quickly, and the API is what really sold us, since we point a dedicated health-check endpoint at it and pull uptime data straight into our internal workflows."

Mariana Kodama
Mariana Kodama

Treasurer, Fundacion Jorge Luis Borges

"There’s an easy way for you to monitor your online project. After all the hard work you have put into going live, you want to make sure that things keep running smoothly while you focus on the next project."

Chris Kalmar
Chris Kalmar

Founder at nineLemon

"Pulsetic is fast and genuinely easy to use. The UI is clean and has the features we actually needed, the status pages look good, and being able to route alerts to several channels was a real plus for us."

Akis Laopodis
Akis Laopodis

Founder at Qurioos

"Pulsetic helps us monitor all of our websites and webapps over at Pairing.dev. Before we used it, we had no idea how often services (e.g. heroku) were offline. Now we have complete control over it."

Till Carlos
Till Carlos

Founder at Pairing.dev

"Using Pulsetic is a big win for us! Our dev team can now deliver faster, with zero time spent monitoring our website uptime. Plus the interface is great and analytics proper."

Razvan Popescu
Razvan Popescu

Head of Marketing at AbstractAPI

Frequently asked questions

  • Can the assistant change things in my account without asking?

    No. Reads happen immediately, but every one of the 34 actions that changes something stops and shows you a plain-language summary with Confirm and Cancel buttons.

  • Which plans include the AI assistant?

    It's included with every paid plan. Access is checked against the team owner and teammates inherit it, so one subscription covers everyone working on the account. Pulsetic's free plan doesn't include the assistant.

  • What data can it see?

    Only your team's. Every read and every action is scoped to your team owner's account, so the assistant can't see or touch another customer's monitors, incidents or analytics. When you build a status page, any monitor or heartbeat you don't own is simply dropped rather than attached.

  • Does it work for teams?

    Yes. Teammates inherit access from the team owner and everyone gets the same assistant with the same capabilities. Every question and every approval is attributable to the person who made it. Team membership is re-verified at the moment a change is confirmed, not just when it was proposed, so someone who has left the team can't complete a pending approval.

  • How is this different from the Pulsetic MCP server?

    The MCP server lets you connect your own AI tools (Claude, ChatGPT, Cursor and others) to Pulsetic. This assistant is the reverse: it's built into your Pulsetic dashboard, with nothing to install or connect. They're complementary, so use the MCP server if you'd rather work inside your own AI tooling.

  • Why can't it tell me the exact error for an outage from last month?

    Detailed per-check failure data (the error message, the HTTP response code and the monitoring location that saw it) is kept for roughly the last 48 hours. Beyond that, the assistant can still tell you that a monitor went down, when, and for how long, and it can produce uptime and downtime statistics over much longer ranges: up to 93 days per question for account analytics, and 92 days for real user monitoring.

  • Stop scanning dashboards. Just ask.

    Included with every paid plan · Nothing to install · Cancel any time

  • Paid plans start at $9 per month