Mark what changed, right on the graph
Add an annotation for a deploy, a config change or a migration, and it appears on your response time chart at that exact minute. The next time the line moves, the reason is already sitting beside it.
"Pulsetic made monitoring something I barely think about anymore. The interface is clean and the tracking is real-time, so I can glance at my site’s performance and get back to work."

Senior Software Engineer at ASML
"Pulsetic is easy-to-use and simple to get started. As an agency, I like that it includes unlimited status pages, because I can create one for each of my clients. Pulsetic includes every alert channel that I want, and advanced settings that give me greater confidence in the uptime. I can require that a response include certain text and respond within a certain timeframe in order for a site to be considered online. This gives me assurance that we would be notified if there were major performance issues or a bad deployment that made the site unusable. These features come with every paid plan, so our monthly bill is predictable. The API is a huge bonus on the teams plan. We have used it to add maintenance windows for certain monitors automatically based on events that happen in other software we use."

CEO at NorthBuilt
"Pulsetic’s monitoring is easy to set up via their super clean, user-friendly UI. I was up and running within only a few minutes. A helpful knowledge base is available for webmasters to refer to if needed. Pulsetic’s pricing is also some of the most competitive in the industry. I highly recommend them for emerging and established agencies alike."

Owner at Sporulate Design
"Pulsetic is easy to set up and integrate. You don’t need much time to get it running. The interface is clear and simple. It’s easy to see what’s going on at a glance. The design looks great, too. I had no trouble finding what I needed and monitoring my sites is straightforward. If you want a simple tool that works well, Pulsetic is a good choice."

CEO at MBDC Media
"The monitoring tool we’ve been waiting for. Super easy to set up monitoring, customizable status page design, and access to notifications across Slack, email and SMS. Pulsetic is awesome."

CEO at Siena AI
"Tens of thousands of business owners from around the world rely on our service, and Pulsetic is the best platform there is to ensure we communicate any downtimes clearly and swiftly to our customers to avoid panic and disappointment. Getting setup on Pulsetic not only been smooth and easy but super joyful too, the design is stunning and customisable unlike any other monitoring platform we’ve used."

Founder, CEO at Plutio
"Pulsetic cut down our uptime monitoring work a lot. We automated uptime tracking and SLA reporting, which took a chunk of manual effort out of our monthly and annual reports. The Slack and email alerts let the team jump on problems quickly, and the API is what really sold us, since we point a dedicated health-check endpoint at it and pull uptime data straight into our internal workflows."

Treasurer, Fundacion Jorge Luis Borges
"There’s an easy way for you to monitor your online project. After all the hard work you have put into going live, you want to make sure that things keep running smoothly while you focus on the next project."

Founder at nineLemon
"Pulsetic is fast and genuinely easy to use. The UI is clean and has the features we actually needed, the status pages look good, and being able to route alerts to several channels was a real plus for us."

Founder at Qurioos
"Pulsetic helps us monitor all of our websites and webapps over at Pairing.dev. Before we used it, we had no idea how often services (e.g. heroku) were offline. Now we have complete control over it."

Founder at Pairing.dev
"Using Pulsetic is a big win for us! Our dev team can now deliver faster, with zero time spent monitoring our website uptime. Plus the interface is great and analytics proper."

Head of Marketing at AbstractAPI
Need access for more than one person? Add teammates for $8 each from the Solo plan, or start with 2 included on Team. Role-based access, from the Team plan, gives each person only the rights they need, so you can collaborate without compromising on security.

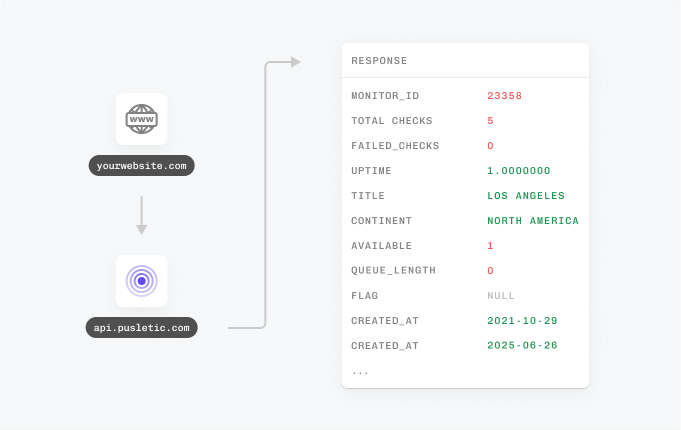
On the Team and Organization plans, Pulsetic’s REST API, MCP server and n8n integration let you automate monitors, status pages, incidents, alerts and integrations from your own code. Best suited for developers in scale-up or large enterprises.
Stay online, all the time, with Pulsetic's uptime prime.
By Designmodo
Designmodo Inc. 169 Madison Ave, #79627, New York, NY 10016, United States
Copyright © 2010-2026. Pulsetic® is a registered trademark.
 Character AI
 ChatGPT
 Claude
 Cloudflare
 Cursor
 DeepSeek
 GitHub
 GoDaddy
 Linear
 npm
npm OpenAI
 Perplexity
 Shopify
 Slack
Slack Stripe
 Supabase
 Vercel
 Zoom
Zoom